

Professional tools and equipment manufacturer Snap-on (NYSE:SNA) missed Wall Street’s revenue expectations in Q3 CY2025, with sales falling 4.5% year on year to $1.19 billion. Its GAAP profit of $5.02 per share was 8.1% above analysts’ consensus estimates.
Is now the time to buy Snap-on? Find out by accessing our full research report, it’s free for active Edge members.
Snap-on (SNA) Q3 CY2025 Highlights:
- Revenue: $1.19 billion vs analyst estimates of $1.26 billion (4.5% year-on-year decline, 5.4% miss)
- EPS (GAAP): $5.02 vs analyst estimates of $4.65 (8.1% beat)
- Operating Margin: 29.2%, up from 26% in the same quarter last year
- Free Cash Flow Margin: 21.7%, up from 18.7% in the same quarter last year
- Organic Revenue rose 3% year on year vs analyst estimates of 1.5% growth (150 basis point beat)
- Market Capitalization: $17.35 billion
Company Overview
Founded in 1920, Snap-on (NYSE:SNA) is a global provider of tools, equipment, and diagnostics for various industries such as vehicle repair, aerospace, and the military.
Revenue Growth
A company’s long-term sales performance is one signal of its overall quality. Any business can experience short-term success, but top-performing ones enjoy sustained growth for years. Unfortunately, Snap-on’s 5.6% annualized revenue growth over the last five years was tepid. This was below our standard for the industrials sector and is a rough starting point for our analysis.
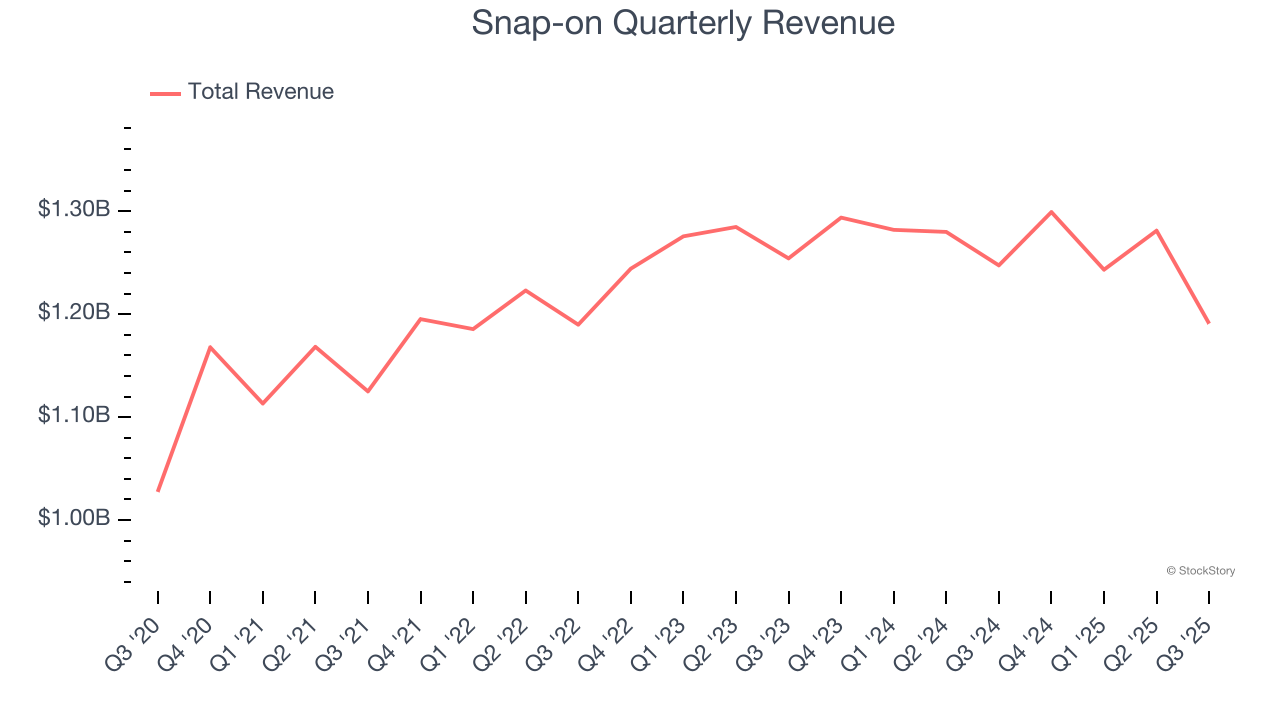
Long-term growth is the most important, but within industrials, a half-decade historical view may miss new industry trends or demand cycles. Snap-on’s recent performance shows its demand has slowed as its revenue was flat over the last two years. 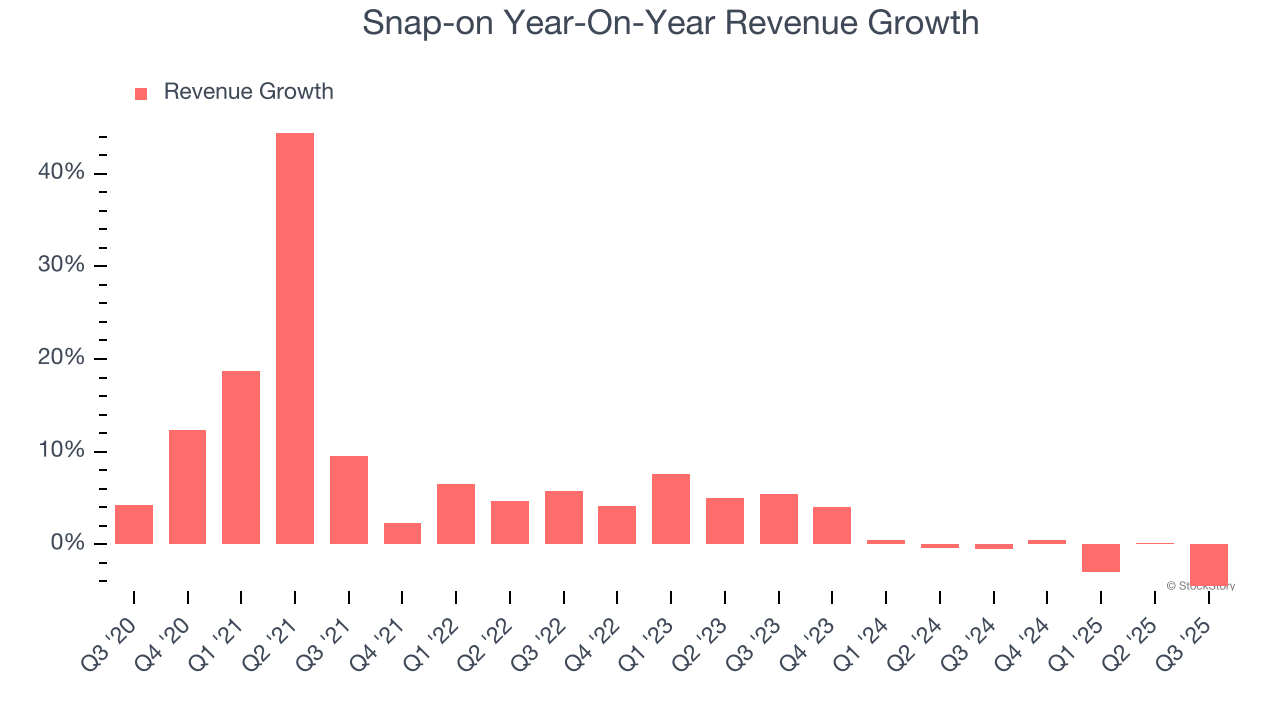
Snap-on also reports organic revenue, which strips out one-time events like acquisitions and currency fluctuations that don’t accurately reflect its fundamentals. Over the last two years, Snap-on’s organic revenue averaged 3.4% year-on-year declines. Because this number is lower than its two-year revenue growth, we can see that some mixture of acquisitions and foreign exchange rates boosted its headline results. 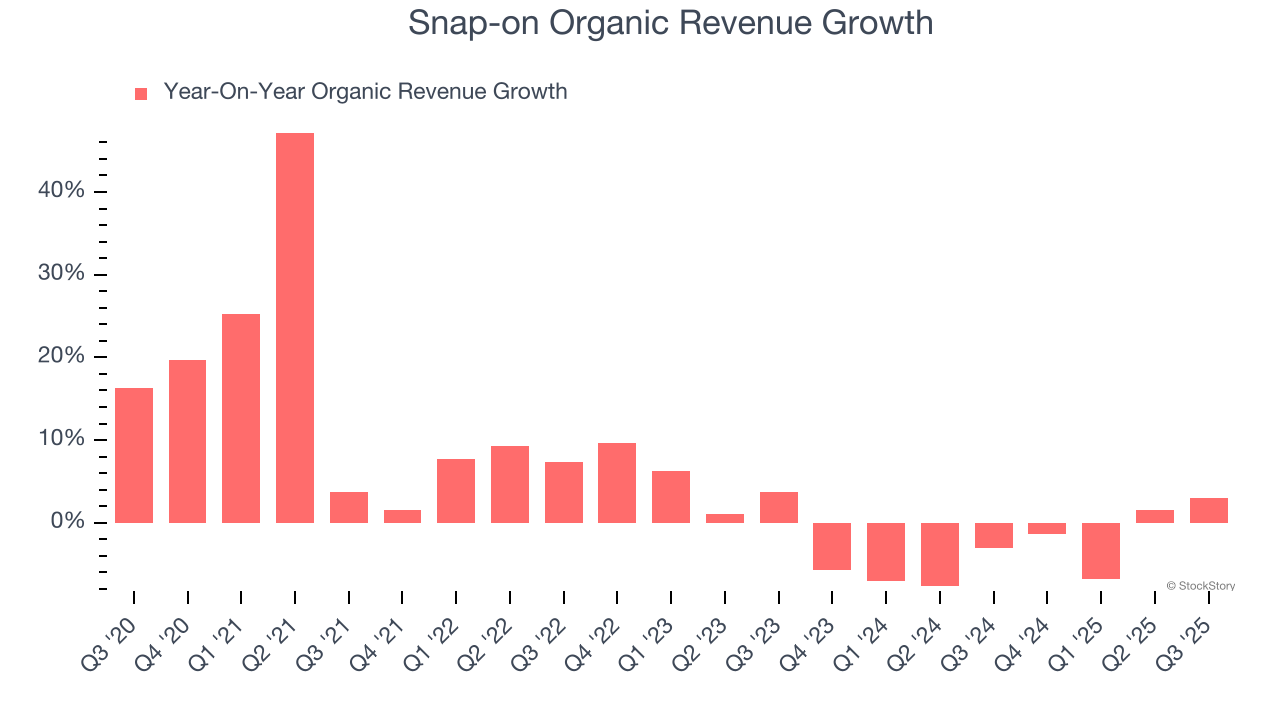
This quarter, Snap-on missed Wall Street’s estimates and reported a rather uninspiring 4.5% year-on-year revenue decline, generating $1.19 billion of revenue.
Looking ahead, sell-side analysts expect revenue to grow 4.1% over the next 12 months. Although this projection indicates its newer products and services will catalyze better top-line performance, it is still below the sector average.
Unless you’ve been living under a rock, it should be obvious by now that generative AI is going to have a huge impact on how large corporations do business. While Nvidia and AMD are trading close to all-time highs, we prefer a lesser-known (but still profitable) stock benefiting from the rise of AI. Click here to access our free report one of our favorites growth stories.
Operating Margin
Operating margin is one of the best measures of profitability because it tells us how much money a company takes home after procuring and manufacturing its products, marketing and selling those products, and most importantly, keeping them relevant through research and development.
Snap-on has been a well-oiled machine over the last five years. It demonstrated elite profitability for an industrials business, boasting an average operating margin of 25.5%. This result isn’t surprising as its high gross margin gives it a favorable starting point.
Looking at the trend in its profitability, Snap-on’s operating margin rose by 2.1 percentage points over the last five years, as its sales growth gave it operating leverage.
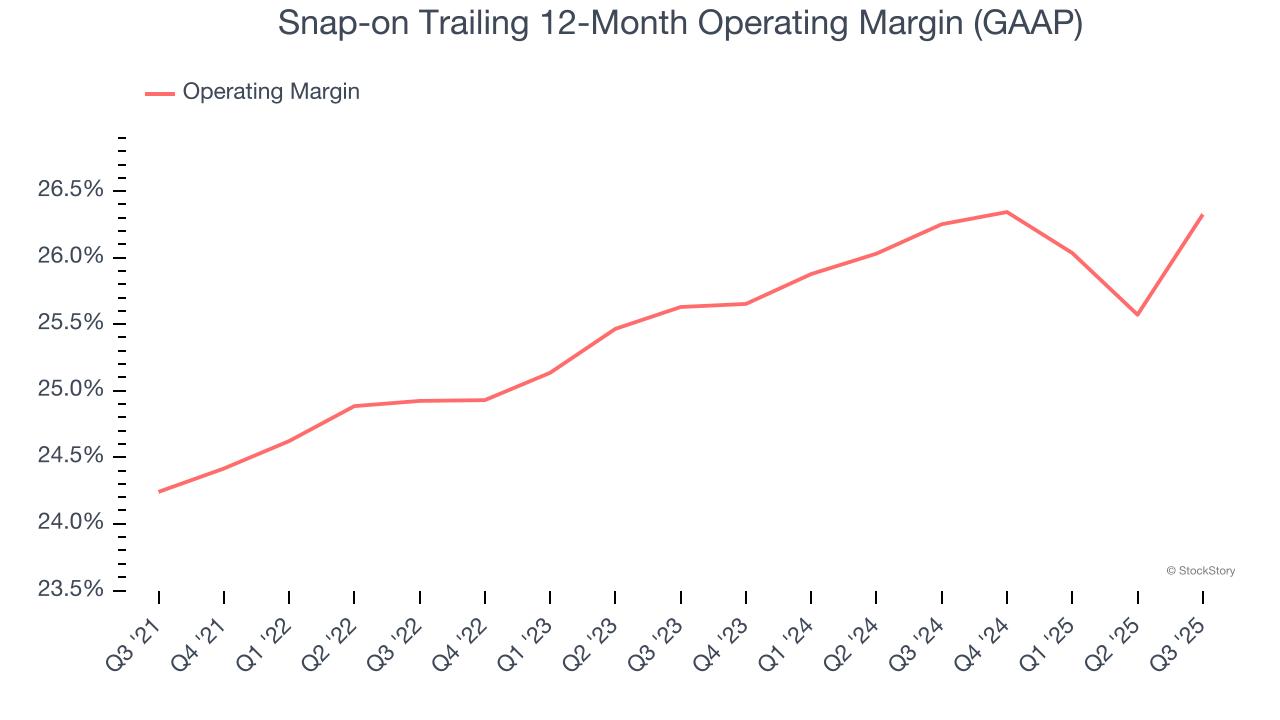
In Q3, Snap-on generated an operating margin profit margin of 29.2%, up 3.2 percentage points year on year. The increase was encouraging, and because its revenue and gross margin actually decreased, we can assume it was more efficient because it trimmed its operating expenses like marketing, R&D, and administrative overhead.
Earnings Per Share
Revenue trends explain a company’s historical growth, but the long-term change in earnings per share (EPS) points to the profitability of that growth – for example, a company could inflate its sales through excessive spending on advertising and promotions.
Snap-on’s EPS grew at a remarkable 12.3% compounded annual growth rate over the last five years, higher than its 5.6% annualized revenue growth. This tells us the company became more profitable on a per-share basis as it expanded.
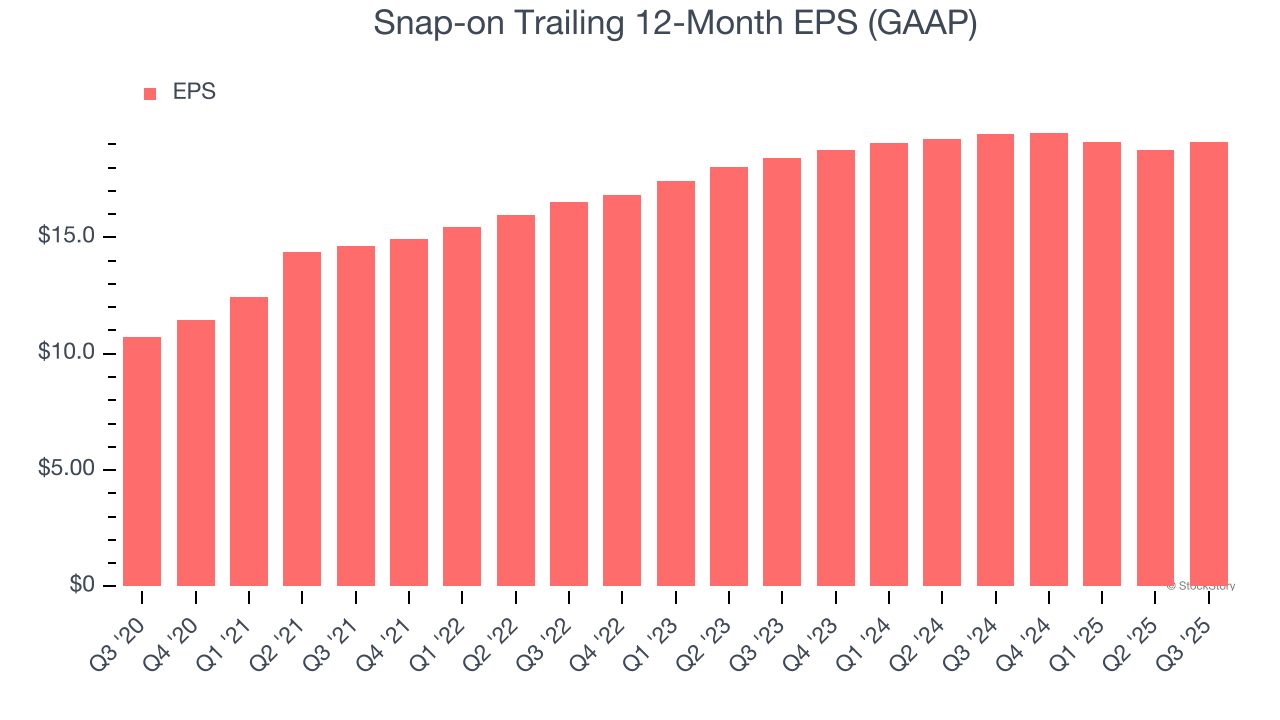
We can take a deeper look into Snap-on’s earnings to better understand the drivers of its performance. As we mentioned earlier, Snap-on’s operating margin expanded by 2.1 percentage points over the last five years. On top of that, its share count shrank by 3.4%. These are positive signs for shareholders because improving profitability and share buybacks turbocharge EPS growth relative to revenue growth. 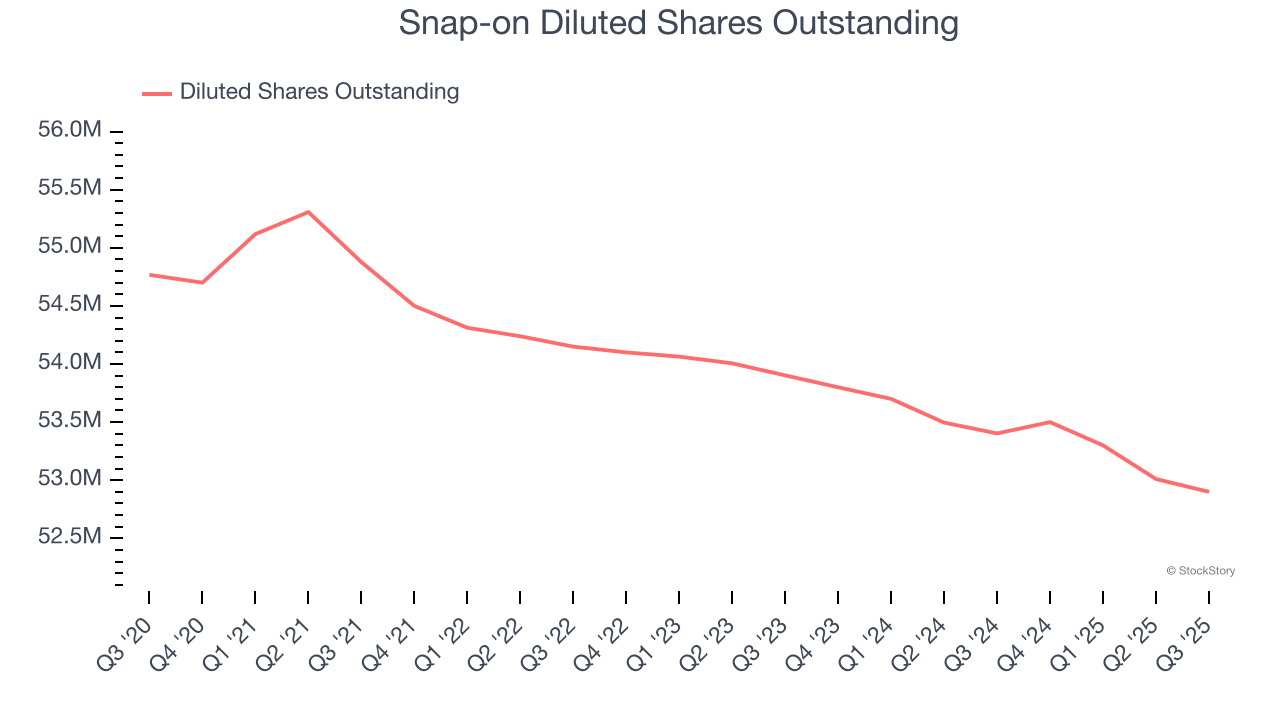
Like with revenue, we analyze EPS over a shorter period to see if we are missing a change in the business.
For Snap-on, its two-year annual EPS growth of 1.8% was lower than its five-year trend. We hope its growth can accelerate in the future.
In Q3, Snap-on reported EPS of $5.02, up from $4.70 in the same quarter last year. This print beat analysts’ estimates by 8.1%. Over the next 12 months, Wall Street expects Snap-on’s full-year EPS of $19.08 to grow 4.1%.
Key Takeaways from Snap-on’s Q3 Results
We enjoyed seeing Snap-on beat analysts’ organic revenue expectations this quarter. We were also glad its EPS outperformed Wall Street’s estimates. On the other hand, its revenue missed. Zooming out, we think this was a mixed quarter. The stock remained flat at $332.59 immediately after reporting.
Big picture, is Snap-on a buy here and now? We think that the latest quarter is only one piece of the longer-term business quality puzzle. Quality, when combined with valuation, can help determine if the stock is a buy. We cover that in our actionable full research report which you can read here, it’s free for active Edge members.